Smart Cities Modules


  • Developers: Dr. Gautam Biswas and Caleb Vatral at Vanderbilt University
  • Course: General university course that is primarily taken by juniors and seniors
  • Knowledge prerequisites: None
  • Data Tool(s):  Github Classroom and Google Colab - it is scaffolded such that students who have no programming experience are able to leverage statistical analysis libraries.
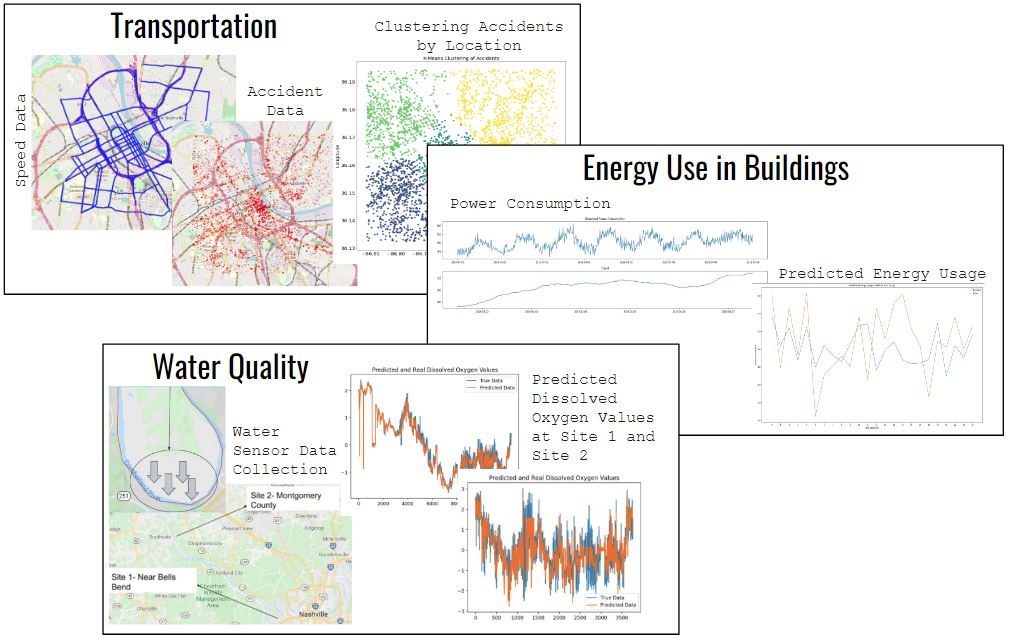
  • Module Focus: Learn and apply advanced machine learning and analytics methods such that in the project portion of the class the students can extract relevant information from real-world data to characteristic problems and propose solutions in areas such as transportation, building energy consumption and water quality
  • Keywords (Disciplinary-Specific): transportation, building energy consumption and water quality
  • Keywords (Data Science): descriptive statistics, histograms, scatter plots, confidence intervals, supervised machine learning, clustering
Sample Projects

Confidence Intervals Module

Supervised Learning Module

Clustering Module

Targeted Data Science Topics and Competencies

  • Data Acquisition (Data Access)
    • Demonstrate an ability to download and format data appropriately
  • Data Visualization (Data Communication)
    • Demonstrate an ability to create a graphical or tabular representation of data
    • Demonstrate an ability to communicate concepts and findings using graphical or tabular representations of data
  • Data Use (Statistical Analysis)
    • Demonstrate an ability to use statistical methods and/or software pertaining to an analysis goal
  • Data Use (Data Communication)
    • Demonstrate an ability to use data to answer clear question by identifying pattern(s) or relationships from complex dataset

Targeted Data Science Topics and Competencies

  • Data Acquisition (Data Access)
    • Demonstrate an ability to download and format data appropriately
  • Data Visualization (Data Communication)
    • Demonstrate an ability to create a graphical or tabular representation of data
  • Data Visualization (Data Interpretation)
    • Demonstrate an ability to interpret graphical and tabular representations
  • Data Use (Statistical Analysis)
    • Demonstrate an ability to identify appropriate statistical methods and/or software for an analysis goal
    • Demonstrate an ability to identify appropriate subset of data for an analysis goal
    • Demonstrate an ability to use statistical methods and/or software pertaining to an analysis goal
    • Demonstrate an ability to compare results of analysis with other findings
  • Data Use (Data Communication)
    • Demonstrate an ability to use data to answer clear question by identifying pattern(s) or relationships from complex dataset

Targeted Data Science Topics and Competencies

  • Data Visualization (Data Communication)
    • Demonstrate an ability to create a graphical or tabular representation of data
  • Data Visualization (Data Interpretation)
    • Demonstrate an ability to interpret graphical and tabular representations
  • Data Use (Statistical Analysis)
    • Demonstrate an ability to identify appropriate statistical methods and/or software for an analysis goal
    • Demonstrate an ability to use statistical methods and/or software pertaining to an analysis goal
    • Demonstrate an ability to compare results of analysis with other findings
  • Data Use (Data Communication)
    • Demonstrate an ability to use data to answer clear question by identifying pattern(s) or relationships from complex dataset

Module Materials

Module Materials

Module Materials

Download Confidence Intervals Module Materials Download Supervised Learning Module Materials Download Clustering Module Materials

Smart Cities - Modules Overview

Smart Cities - Course Overview

Smart Cities - Real-World Project Overview